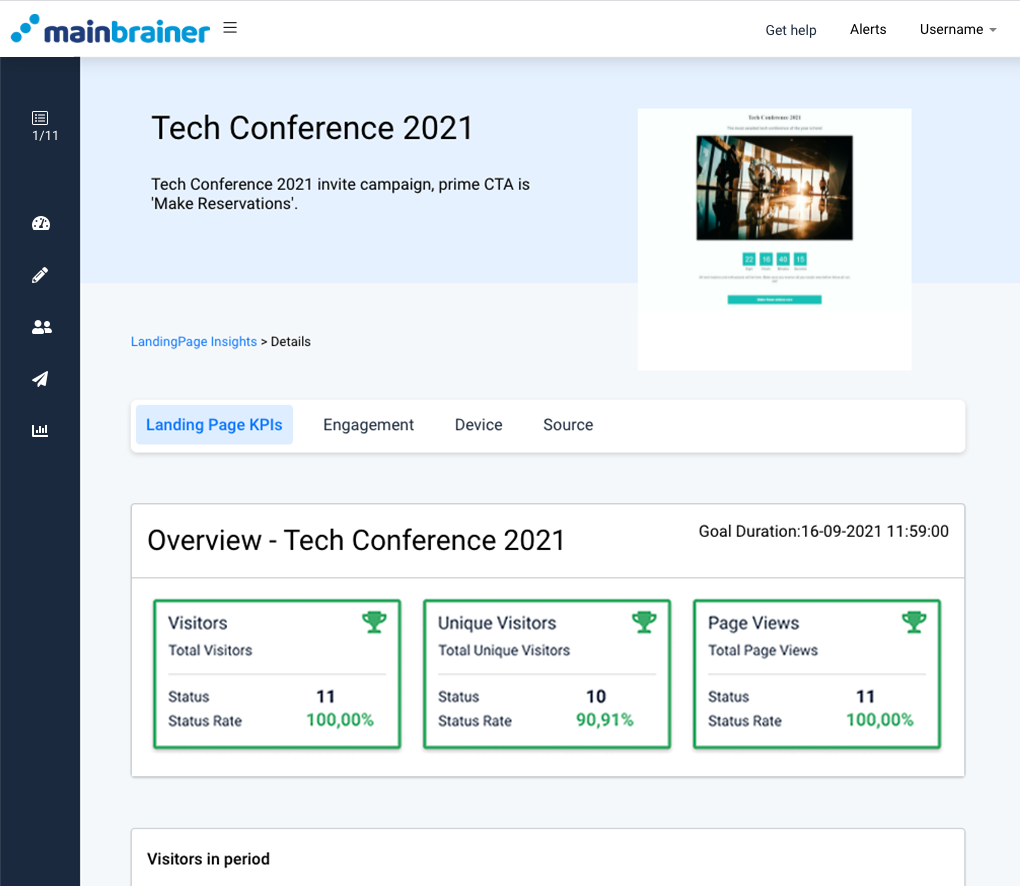
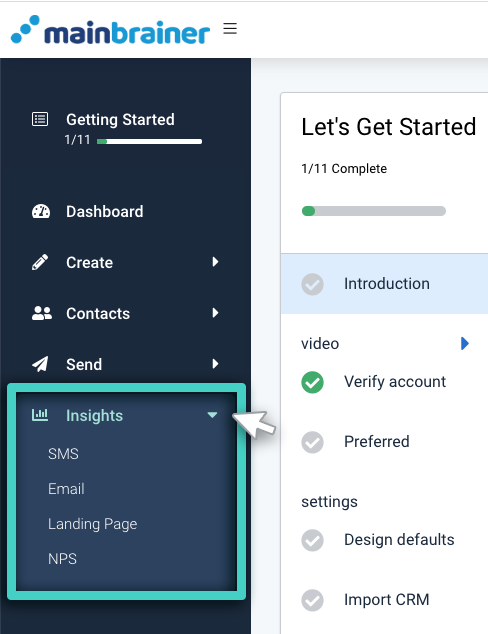
The Insights menu houses the navigation options for performance analytics of all the campaigns sent via MainBrainer – SMS, Email, Landing Page, and NPS.
Here’s a video demonstration to help you familiarize yourself with the Insights UI and features:
To access the Insights data for your sent campaigns, expand the Main Menu on the left, and select the campaign type for which you wish to view the performance analytics. As you do, you will be redirected to the aggregate performance overview with the different KPIs and their values for that campaign type.
Let’s now look at the different UI components on an analytics page with the help of an example. For the purpose of this article, let’s take the example of the analytics page for Landing Pages.
Landing pages Overview – 30 Days of Aggregated Insights
As you click Landing Page in the Insights menu, the subsequent screen, by default, displays the Landing Pages Overview tab wherein different KPIs indicate how your landing pages have performed to date (i.e., aggregate data for all the landing pages sent out to date).
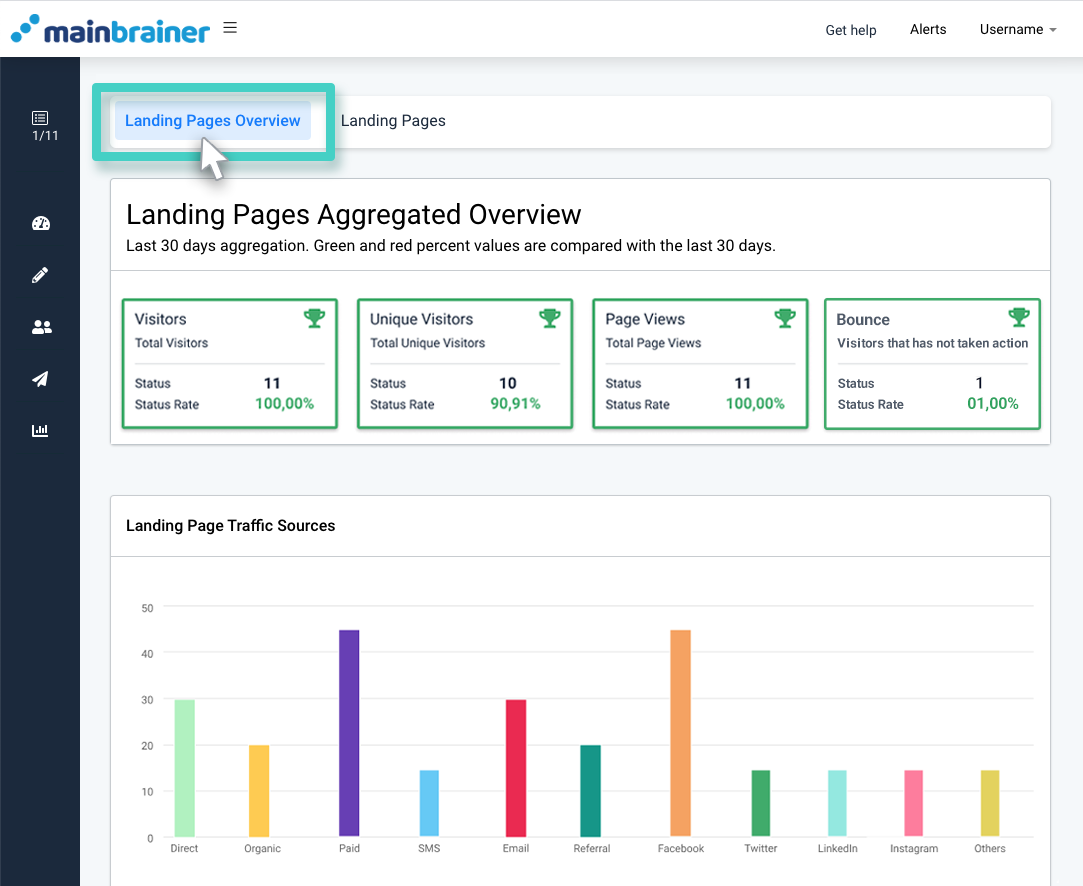
As you scroll down on this page, you’ll notice different sections on this page:
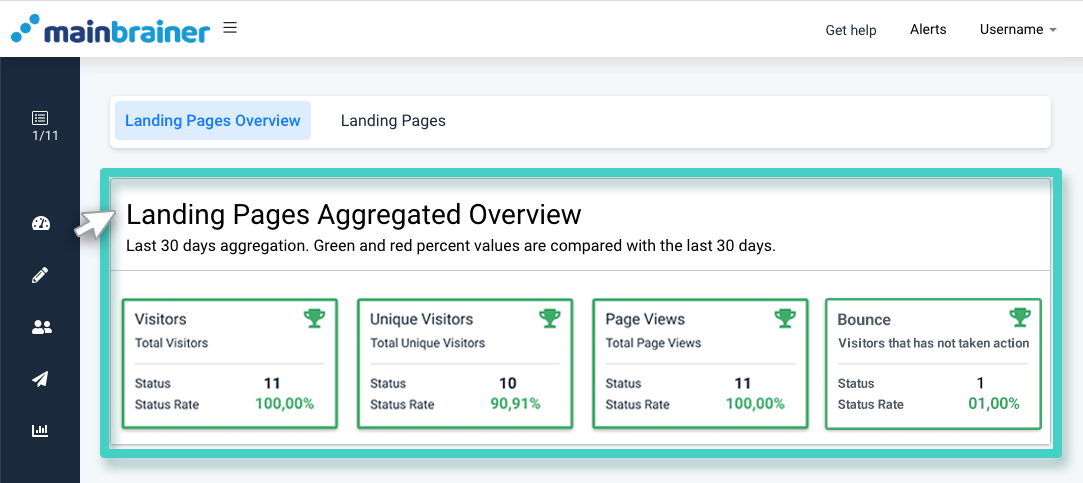
1. Landing Page Aggregated Overview
This area displays all the pinned KPIs with their values for your easy reference. You may edit this section as you prefer by pinning KPIs from the Landing Page Insights section further down on this page.
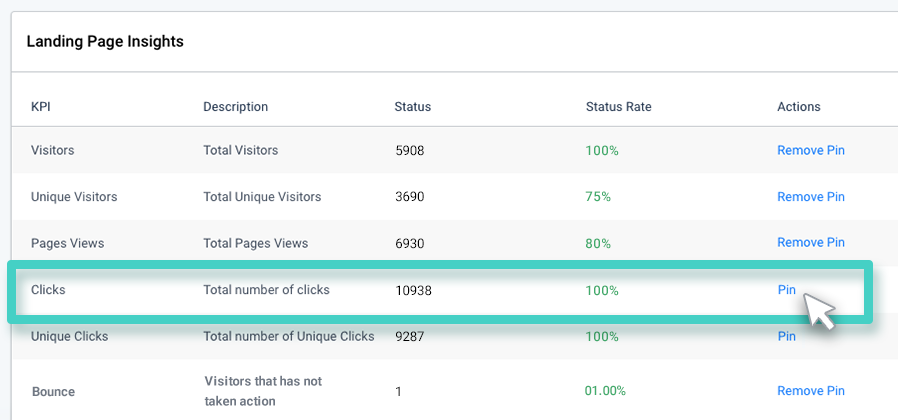
To pin the KPIs to this section, scroll down this page to the Landing Page Insights section and click the Pin button under the Actions column (as highlighted in the screenshot below).
2. Landing Page Traffic Sources
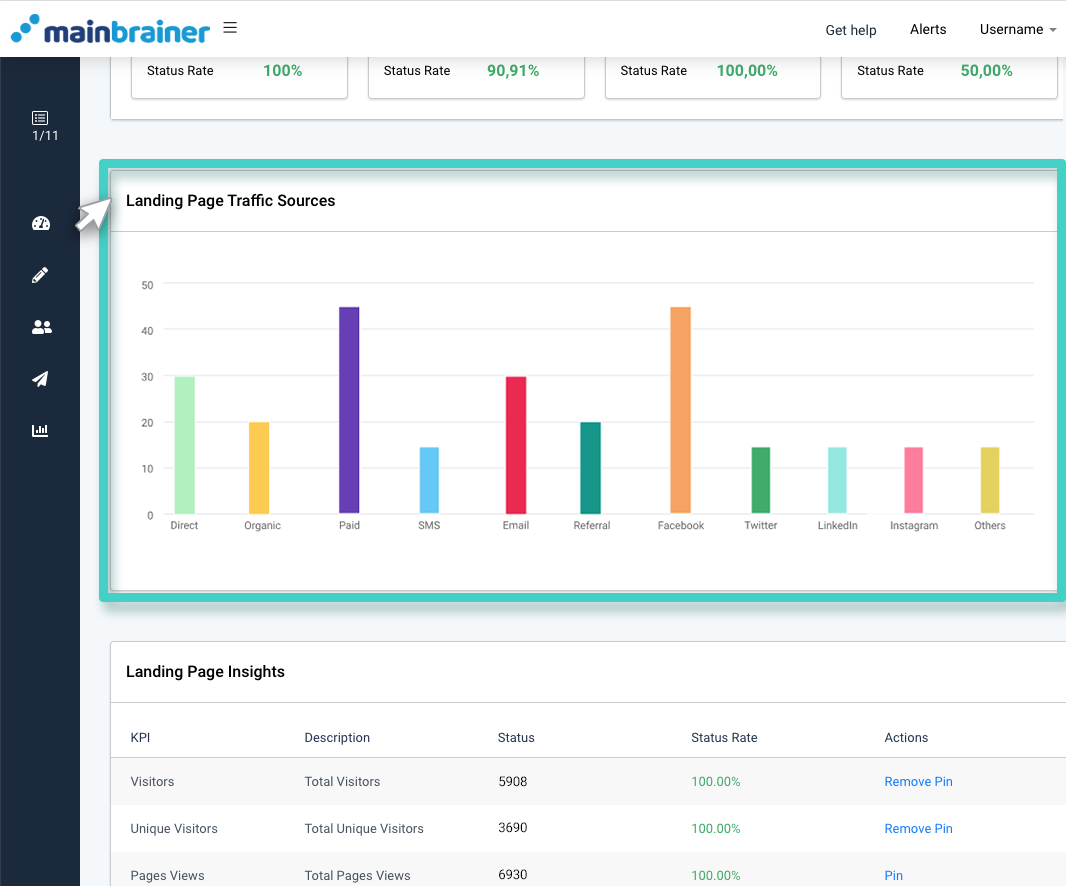
This section displays graphically the breakup of traffic sources for the number of visitors received on your landing pages. This data is calculated for the total traffic received on all your landing pages combined to date.
3. Landing Page Insights
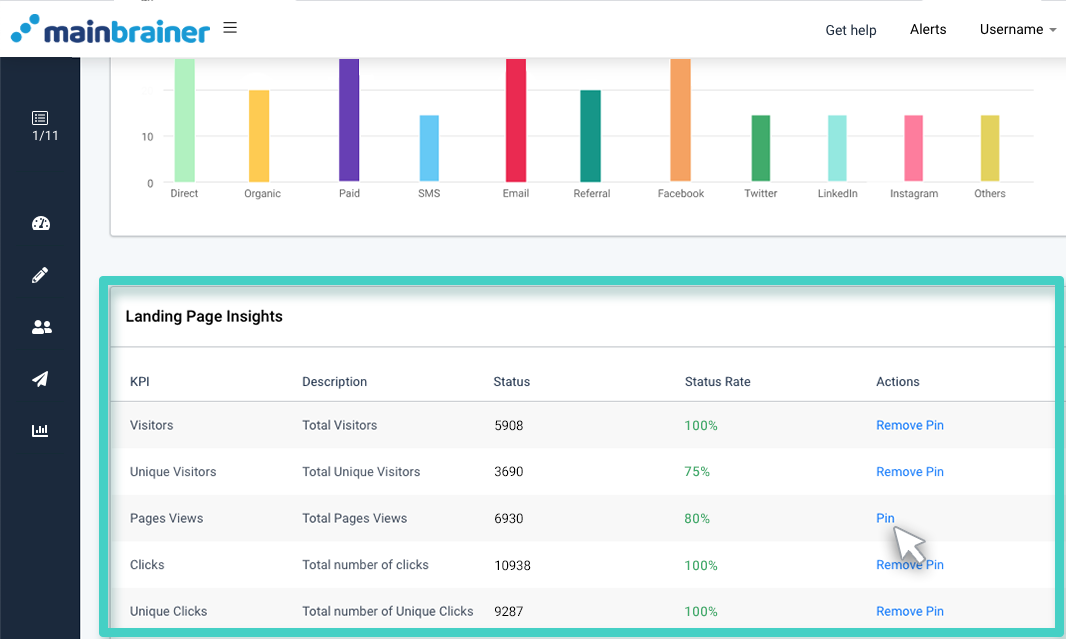
This section lists the KPIs and their values for all your landing pages. Against each KPI, there is an option to Pin it to the Landing Pages Aggregated Overview section for easy reference. You can choose to pin as many KPIs as you wish.
Landing Page – Specific Analytics
If you wish to view the analytics for a specific landing page, click the Landing Pages tab (as highlighted in the screenshot below). As you do, a list of all the landing pages created so far will be displayed.
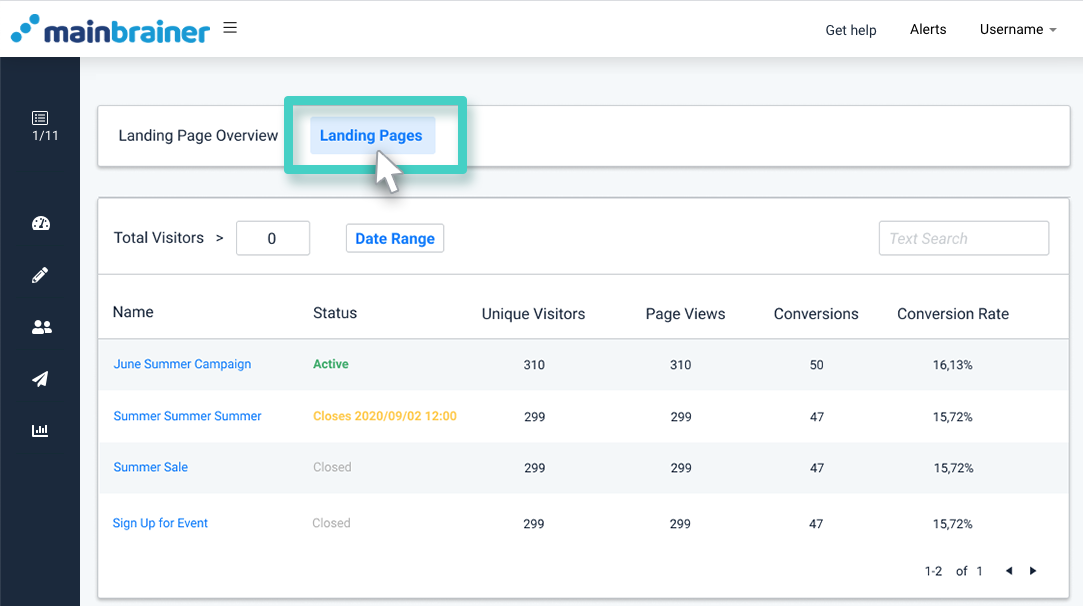
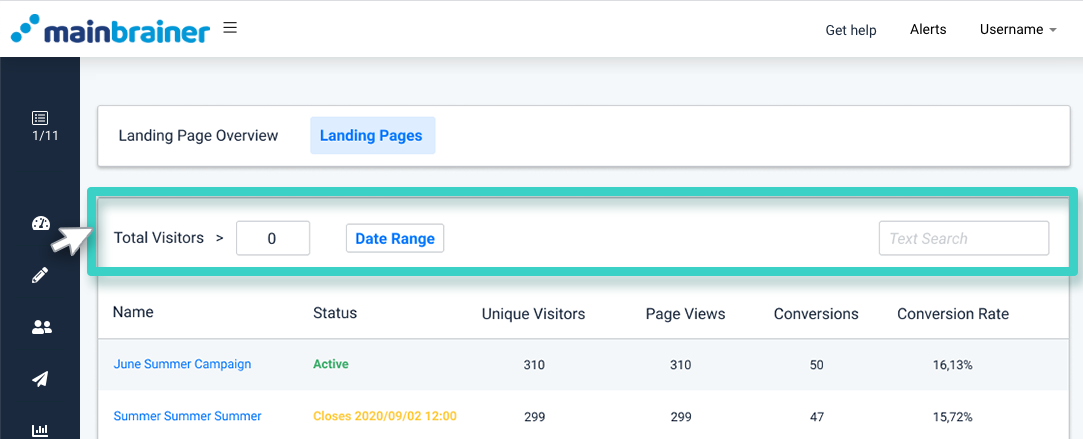
You can filter this list using the landing page name, the number of visitors received by the landing page, or the date range of landing page creation by using the fields highlighted in the screenshot below. Navigate to the desired landing page, and click the landing page name.
The subsequent page displays all the KPIs and their real-time values for the selected landing page:
