Survey – Aggregate Analytics
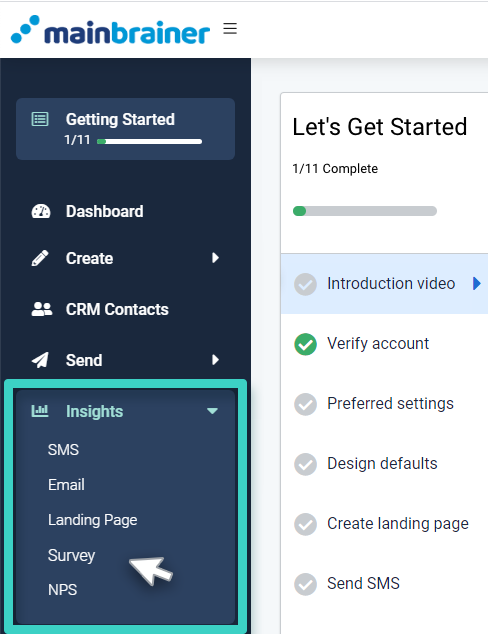
Using the Main Menu on the left, expand the Insights menu, and click Survey.
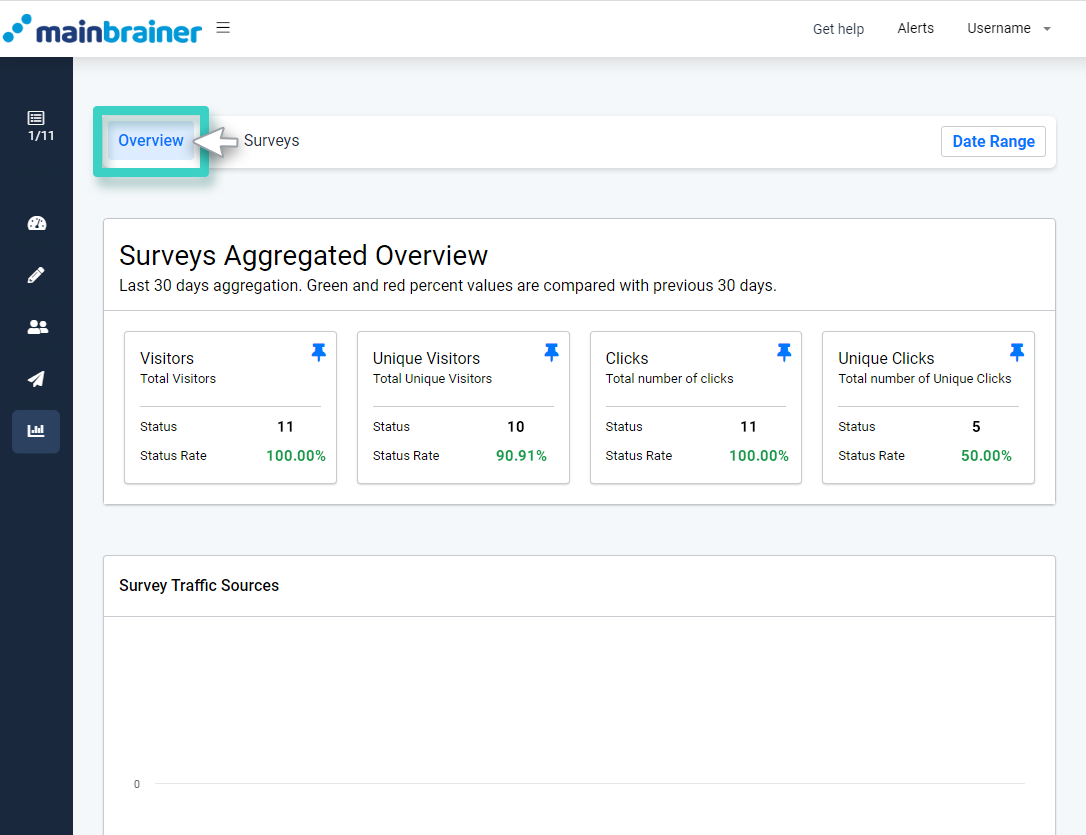
The subsequent screen, by default, displays an overview of the different surveys KPIs and their values.
On this page:
- The Survey Aggregated Overview section displays all the pinned KPIs with their values for your easy reference.

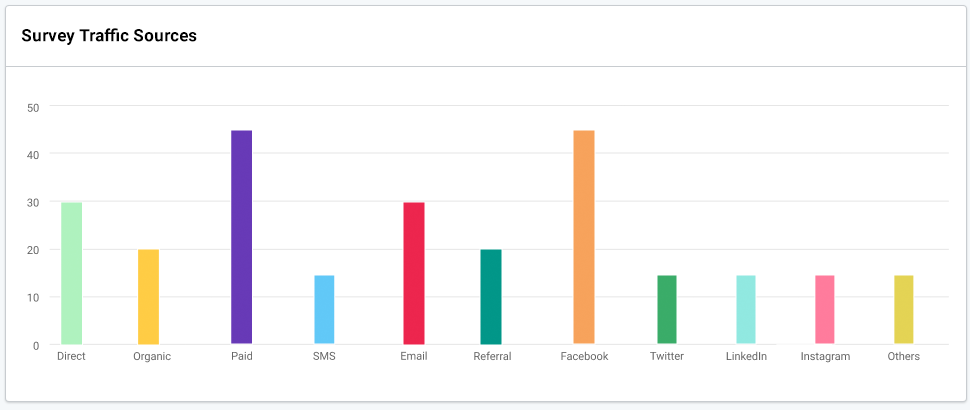
- The Survey Traffic Sources section graphically displays the traffic source-wise breakup of the number of visitors received on your survey.
- The Survey Insights section lists the KPIs and their values for all your surveys.
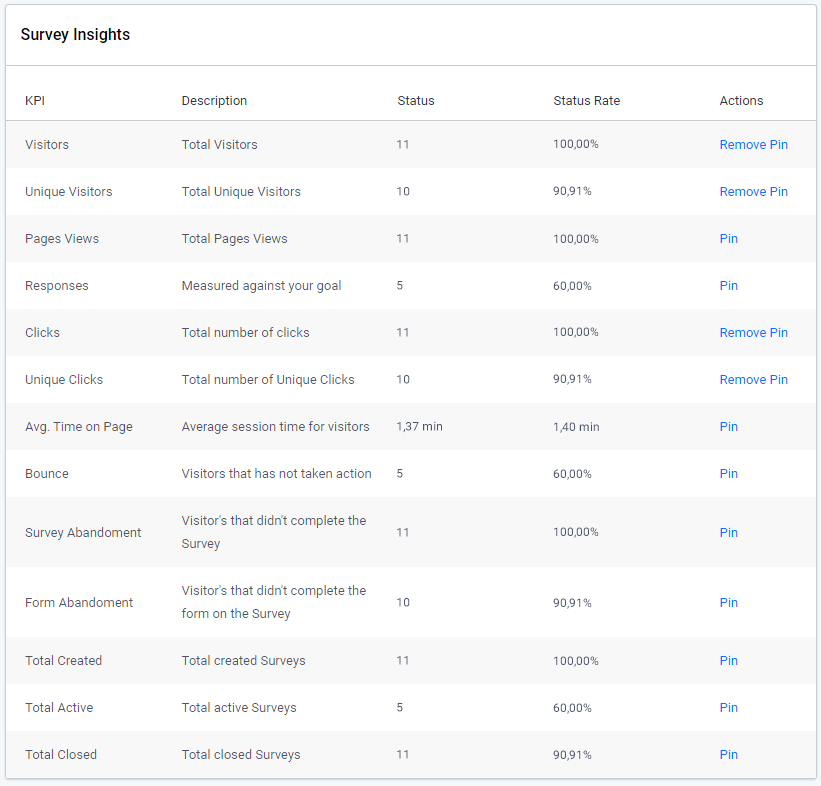
Here is the list of different KPIs and what they mean:
KPI |
KPI values and their significance |
||
| Status | Status Rate | ||
| Visitors | The cumulative number of visitors received by your survey to date. | ||
| Unique Visitors | The cumulative number of unique visitors received by your survey to date. | The number of unique visitors as a percentage of the total number of visitors. | |
| Page Views | The cumulative number of views received by all pages associated with your survey to date. | The number of page views as a percentage of the total number of visitors. | |
| Responses | The cumulative number of responses received by your survey to date. | The number of clicks as a percentage of the total number of visitors. | |
| Clicks | The cumulative number of clicks received by your surveys to date. | The number of clicks as a percentage of the total number of visitors.
i.e., Out of the total number of people who visited your surveys, how many of them clicked through? |
|
| Unique Clicks | The cumulative number of unique clicks received by your survey to date. | The number of unique clicks as a percentage of the total number of visitors. | |
| Average Time on Survey | Average session time for visitors | ||
| Bounce | The cumulative number of visitors who did not take any action on your surveys. | The number of bounces as a percentage of the total number of visitors. | |
| Survey Abandonment | The cumulative number of visitors who opened the survey but did not complete it. | The number of abandonments as a percentage of the total number of people who opened the survey. | |
| Form Abandonment | The cumulative number of visitors who opened the signup form but did not complete it on the survey. | The number of form abandonments as a percentage of the total number of people who opened the signup form. | |
| Total Created | The cumulative number of surveys created in the account. | ||
| Total Active | The cumulative number of active surveys in the account. | The number of active surveys as a percentage of the total number of surveys. | |
| Total Closed | The cumulative number of inactive surveys in the account. | The number of inactive surveys as a percentage of the total number of surveys. | |
For easier identification of the metric ranges, we follow the following color-coding to highlight the different range values of the Status rates:
- Status rates < 20% are highlighted in red font.
- 20% < Status rates < 40% are highlighted in yellow font.
- Status rates > 40% are highlighted in green font.
Survey – Specific Analytics
If you wish to view the analytics for a specific survey, use the Surveys tab and navigate to the desired survey.
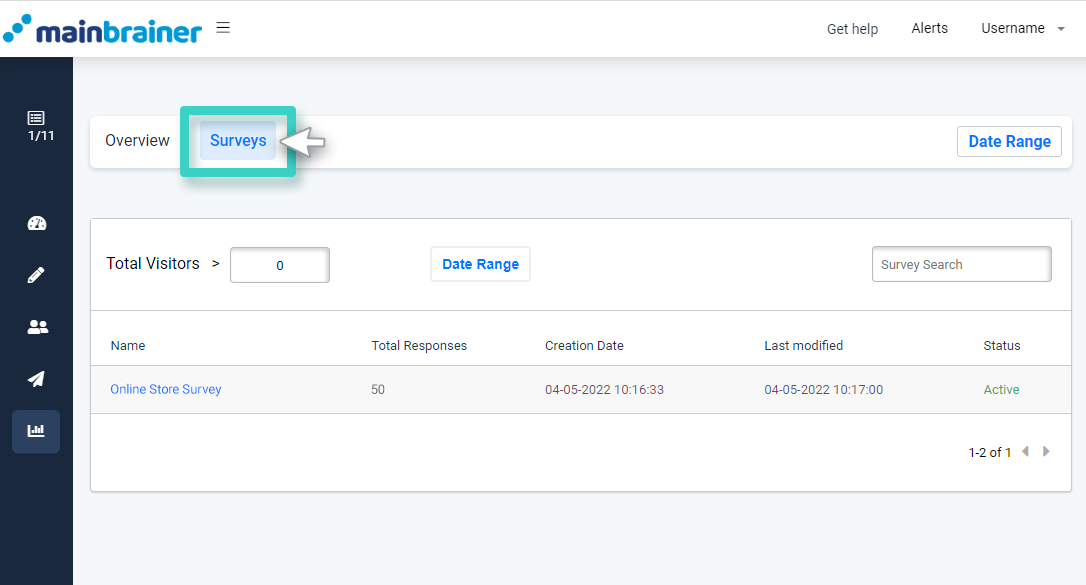
The subsequent page displays all the KPIs and their real-time values for the selected survey under four different tabs:
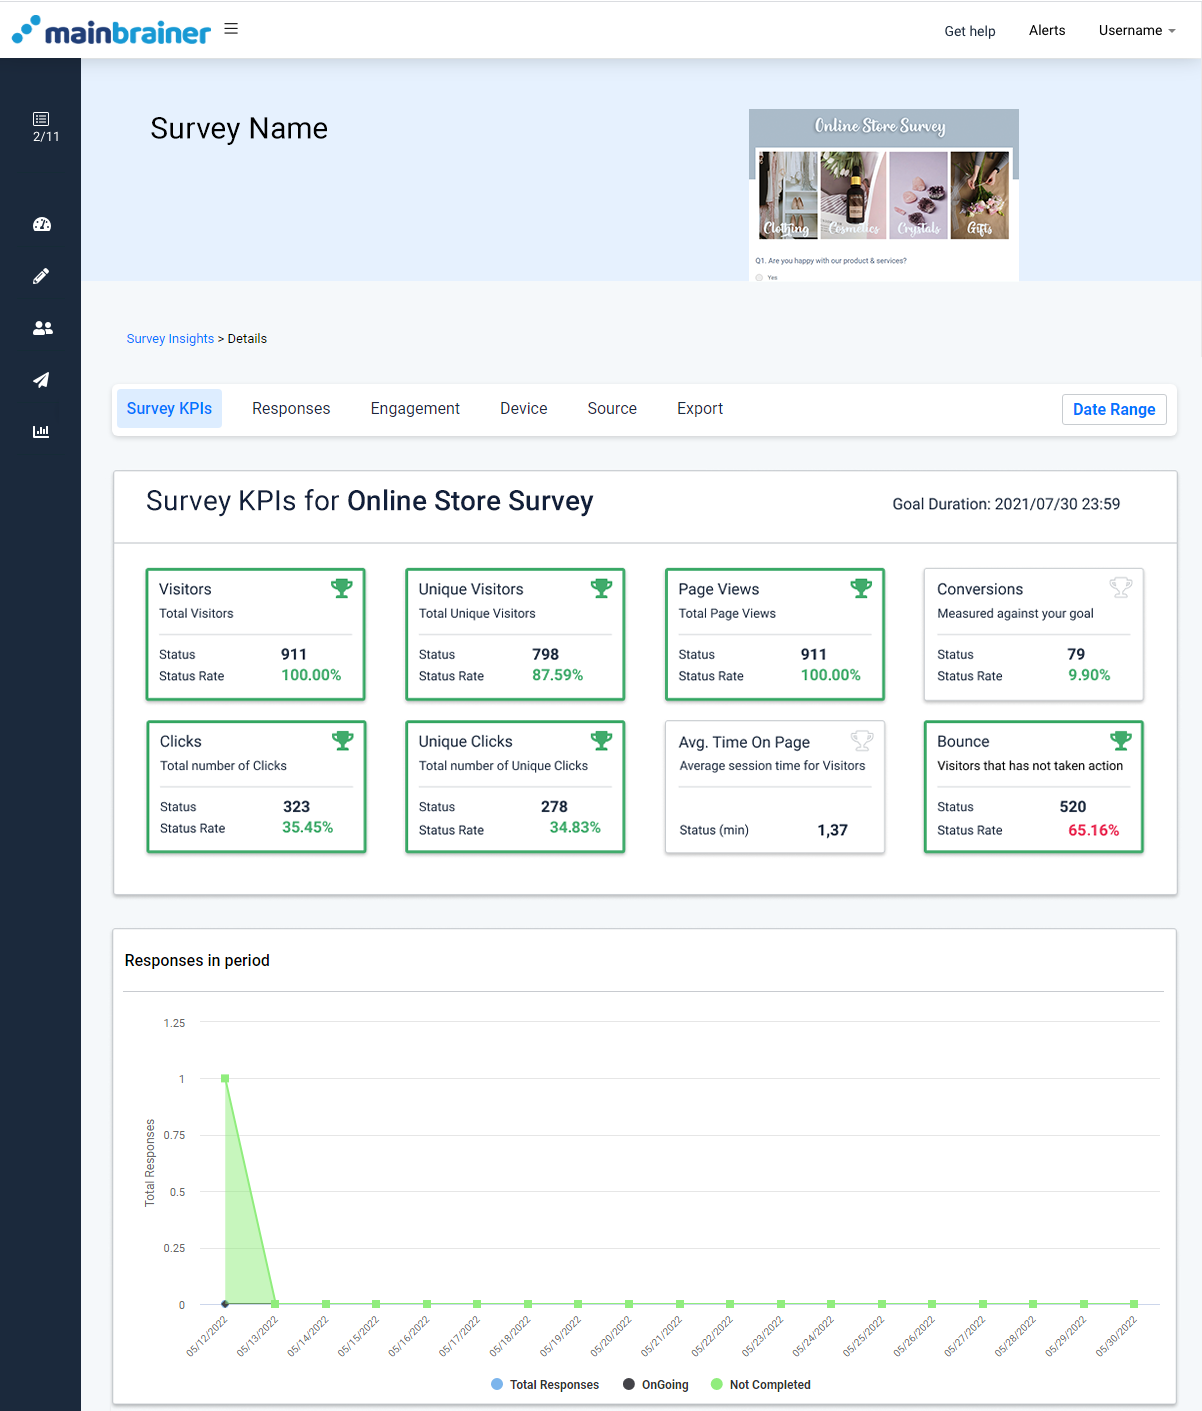
- Survey KPIs – The data under this tab highlights the specified survey’s performance statistics in the last month.
- When you open the tab, you can see an overview of the performance statistics. The graph shows you the responses your survey has received during its active period.

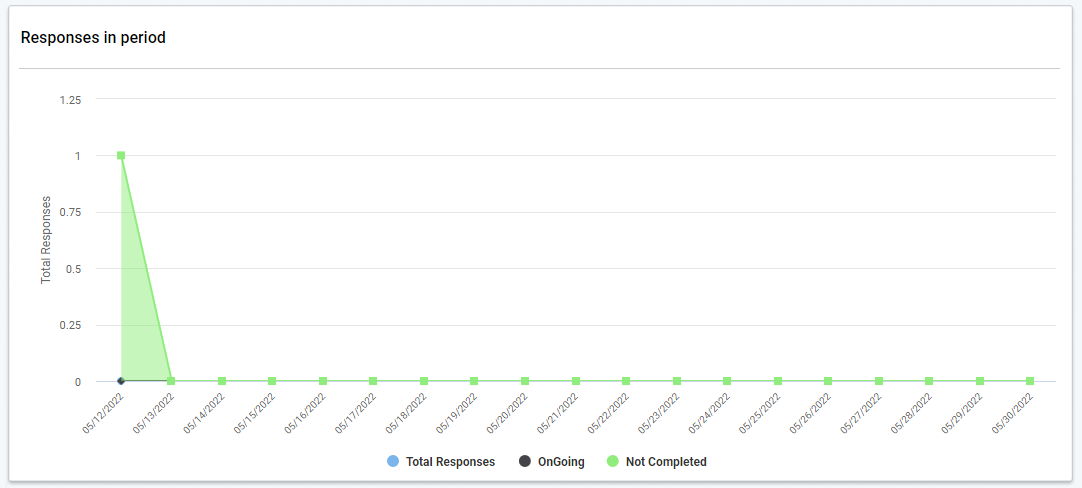
Under the graph are the Survey Insights with nine KPIs to help you understand your survey’s performance.
KPI |
KPI values and their significance |
|
| Status | Status % | |
| Total Visitors | The total number of visitors received by your survey to date. | |
| Unique Visitors | The number of unique visitors as a percentage of the total number of visitors. | The number of unique visitors as a percentage of the total number of visitors. |
| Page Views | The cumulative number of views received by all pages associated with your survey to date. | The number of page views as a percentage of the total number of visitors. |
| Total Responses | The total number of responses received by your survey to date. | |
| Unique Responses | The cumulative number of clicks received by your surveys to date. | The number of clicks as a percentage of the total number of visitors. |
| Unique Clicks | The cumulative number of unique clicks received by your survey to date. | The number of unique clicks as a percentage of the total number of visitors.
i.e., Out of the total number of people who visited your surveys, how many of them clicked through? |
| Ongoing responses | The number of unique clicks as a percentage of the total number of visitors. | |
| Not Completed | The cumulative number of visitors who started the survey but didn’t complete it. | |
| Average Time on Survey | Average session time required to complete the survey | |
| Bounce | The cumulative number of visitors who did not take any action on your surveys. | The number of form abandonments as a percentage of the total number of people who opened the signup form. |
You can pin any of these KPIs to show in the Overview so that you can check the vital numbers quickly.
- Responses – The data under this tab highlights how your audience has responded to your survey.
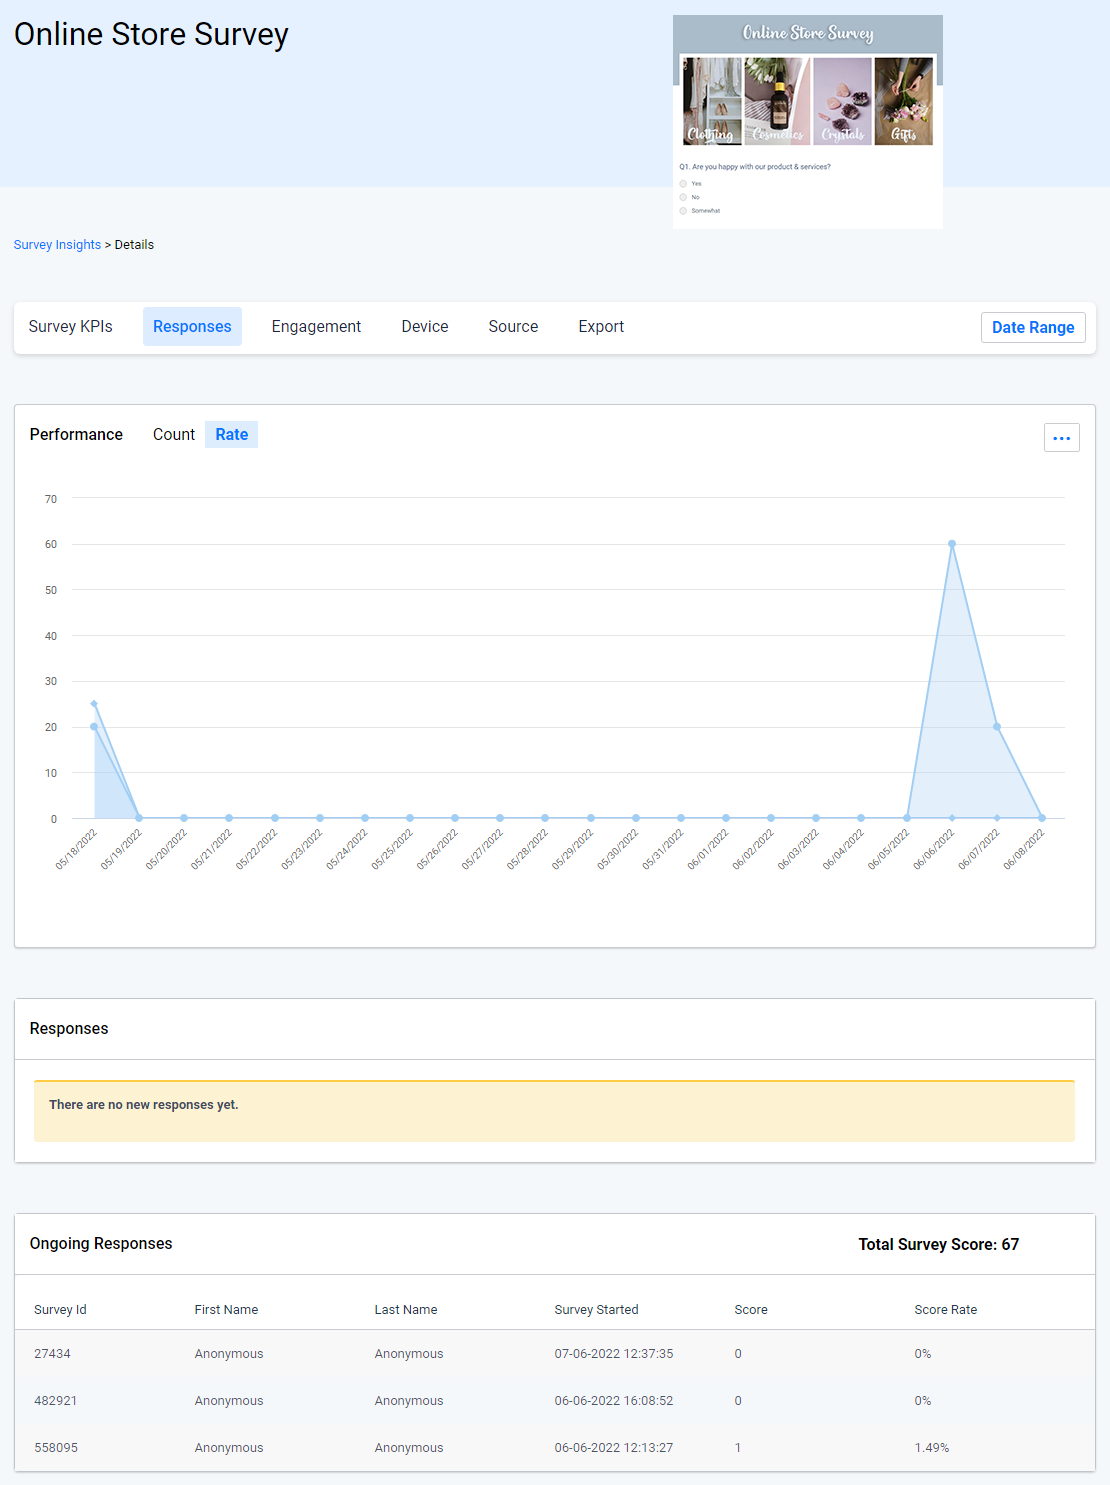
The performance graph shows you the audience response on your graph based on Count and Rate.
The Count graph shows you the number of people who have responded to your survey on a particular date within your survey’s active period. The Rate graph shows the same date in percentage form. You can even download this graph in different formats by clicking on the three dots on the right hand side of the graph.
Responses show you the number of total visitors who have submitted the survey successfully.
The ongoing responses data show you who all are still completing your survey along with the total survey score. The table under shows the data of the contacts who are still completing the survey. It shows Survey ID, name, Survey start date, score, and score rate.
The individual score and score rates can help you determine how each contact is performing in the survey.
- Engagement – The data under this tab highlights the overall performance statistics of the widgets used in the specified survey.
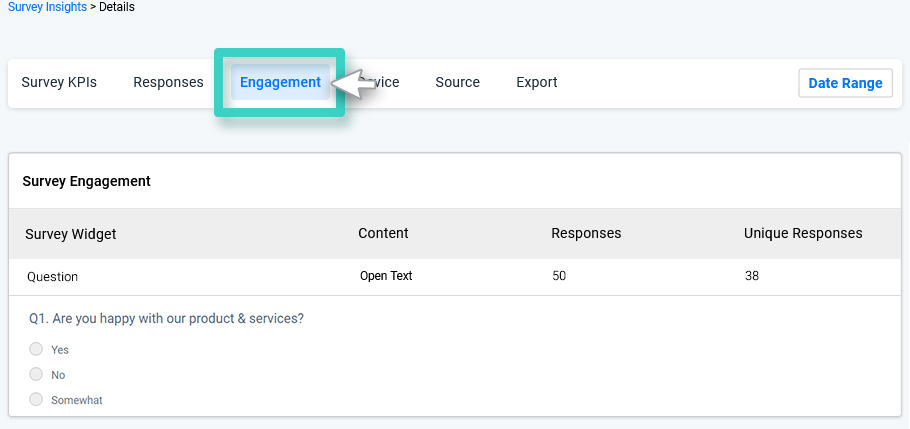
The tab shows audience engagement for each widget like the Question Widget, Signup Form, Image widget, etc that you used in the survey.. You can easily view the Click through rate, Unique Click through rate, Responses, and Unique Responses.
- Device – The data under this tab compares the performance statistics of the survey across different devices.
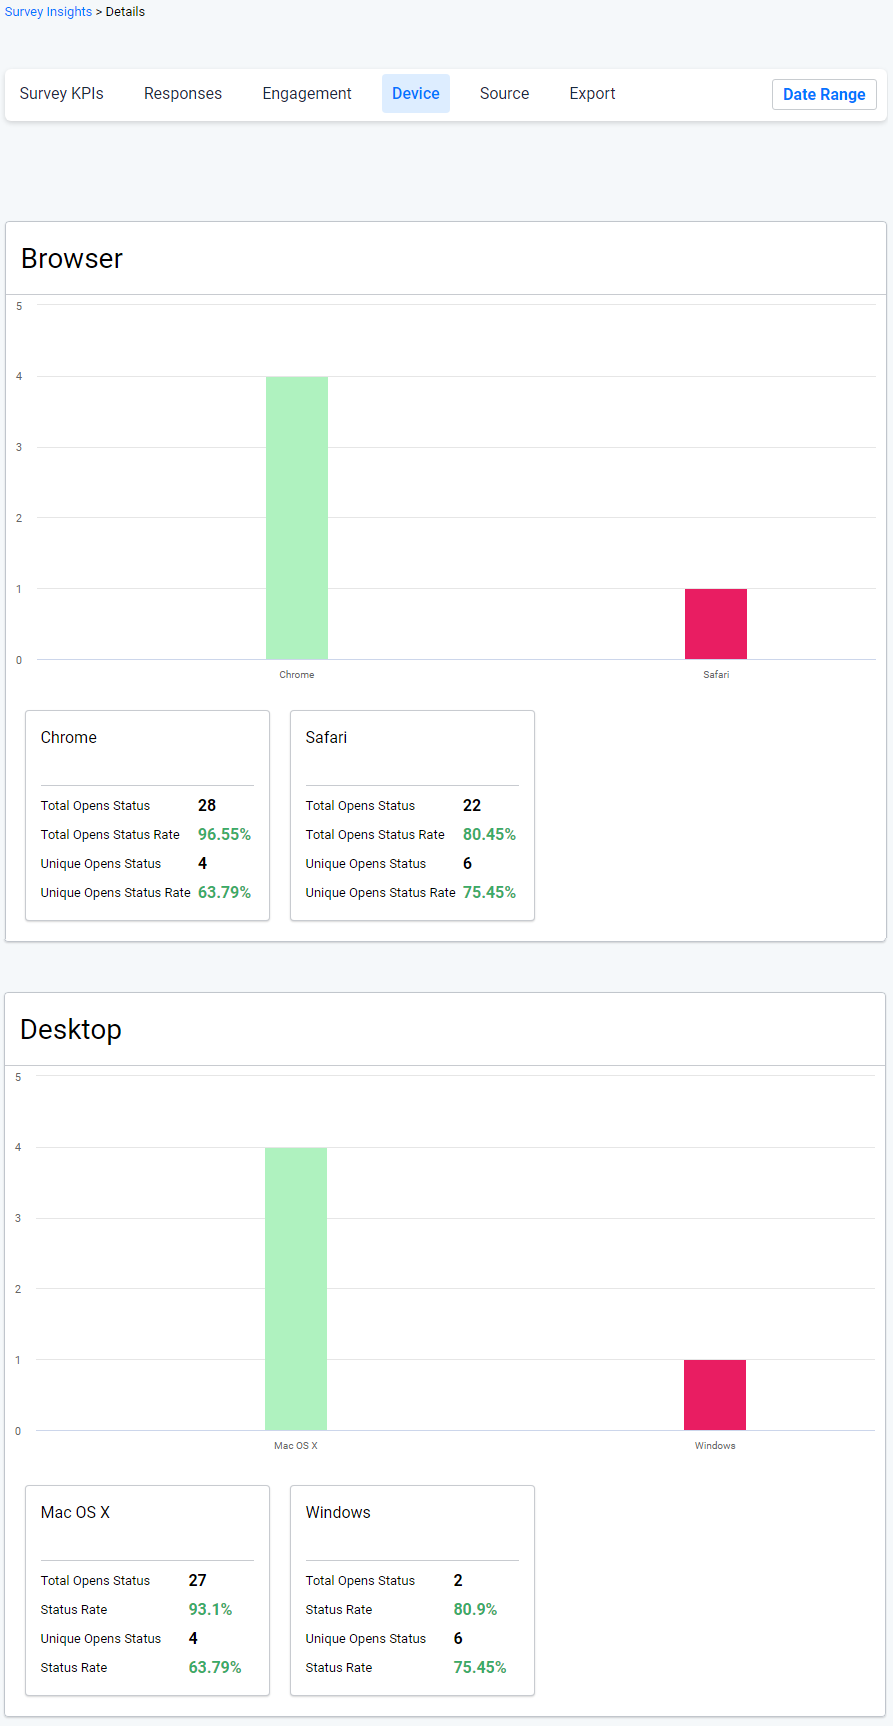
In the tab, you can view the number of contacts who responded to your survey via different mobile devices, browser, and desktops.
- Source – The data under this tab compares the performance statistics of the survey across different traffic sources.
You can see traffic on your survey received through different sources such as SMS, Email, Facebook, Instagram, etc. The graphical representation shows you how many visitors the survey received through each source.

The Traffic Performance Per Source shows you how each source has performed based on different criterias. These criterias are:
- Visitors
- Bounce Rate
- Conversion Rate
- Conversion
- Conversion Revenue
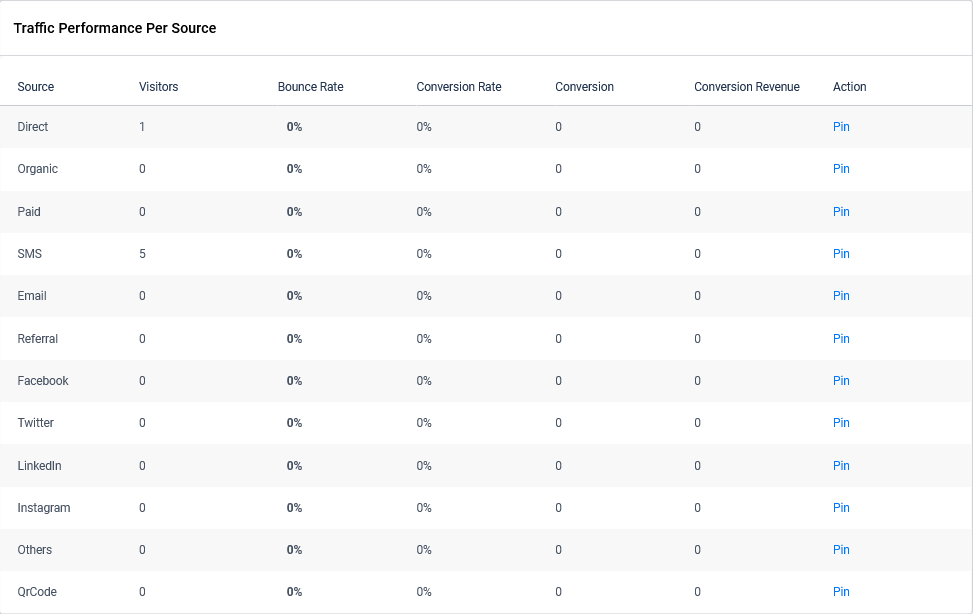
These criterias can help you determine how each source is performing and how you can shape your strategy for the future with focus on specific sources.
