How to View Aggregate Analytics for SMS Sendings?
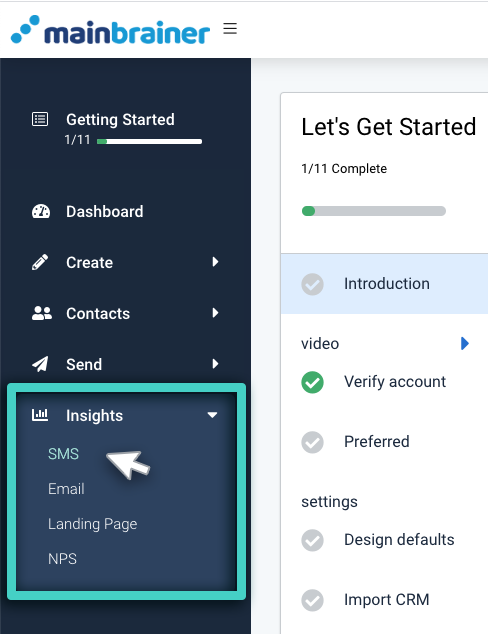
Using the Main Menu on the left, expand the Insights menu, and click SMS.
The subsequent screen, by default, displays an overview of the SMS sending KPIs and their values:
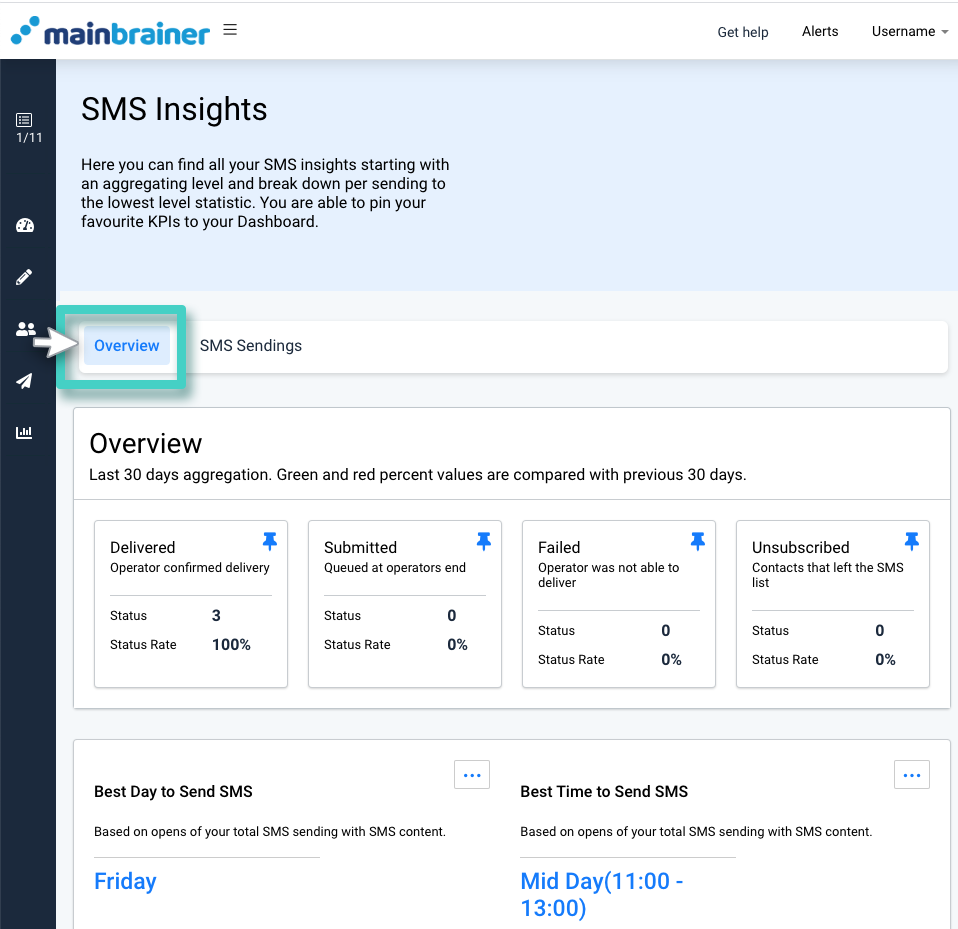
As you scroll down this page, you’ll notice the following three sections:
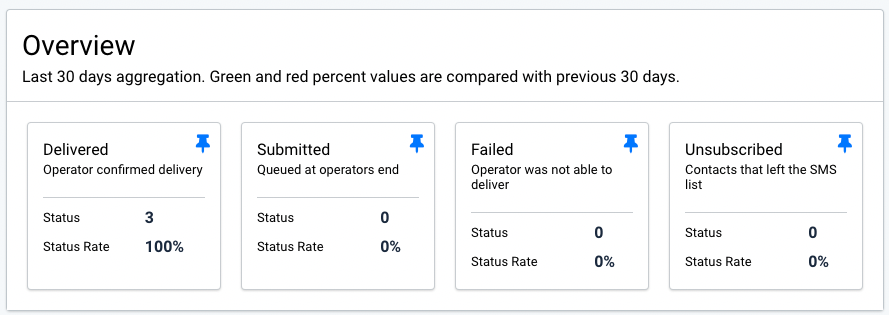
1. The Overview section displays all the pinned KPIs with their values for your easy reference.
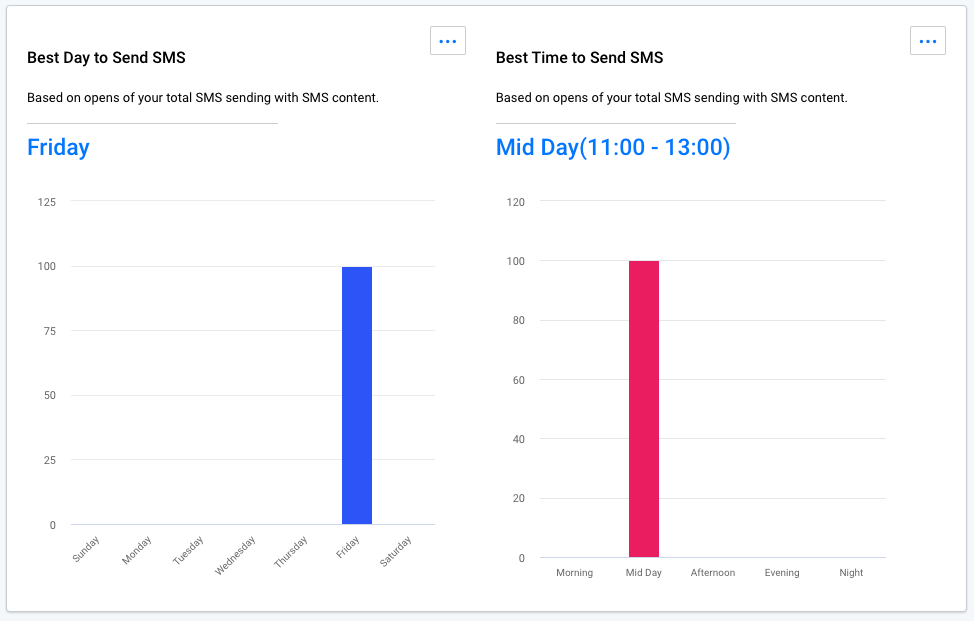
2. The Best Day to Send SMS, and the Best Time to Send SMS sections display the best day and time to send SMSs to your audience, i.e., the day and time when the customer engagement is the highest.
3. The Aggregated SMS Insights section lists the SMS KPIs and their values for all your SMS sendings to date.
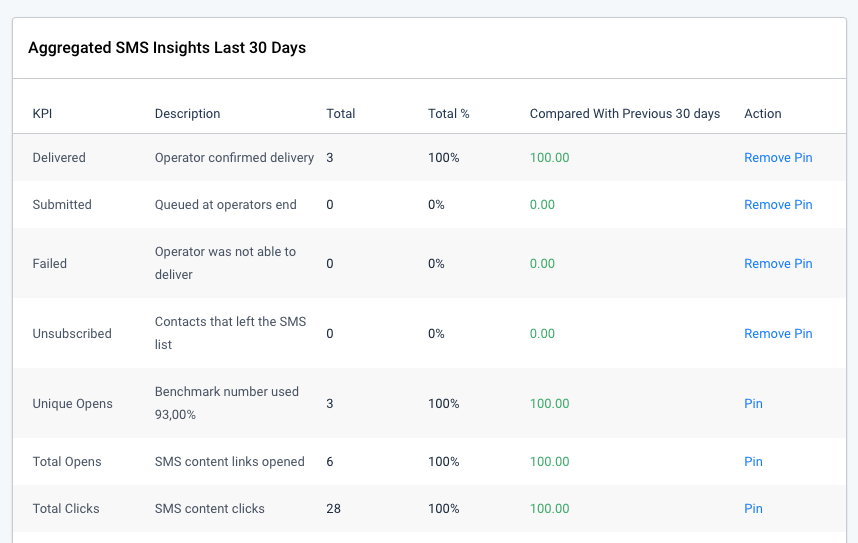
Corresponding to each KPI, the absolute values are displayed under the column Total, and percentage values are displayed under the column Total %.
For easier identification of the metric ranges, we follow the following color-coding to highlight the different range values of the Status rates:
- Status rates < 20% are highlighted in red font.
- 40% < Status rates < 20% are highlighted in yellow font.
- Status rates > 40% are highlighted in green font.
SMS Sending – Specific Analytics
If you wish to view the analytics for a particular SMS sending, use the SMS Sendings tab to navigate to the desired sending.
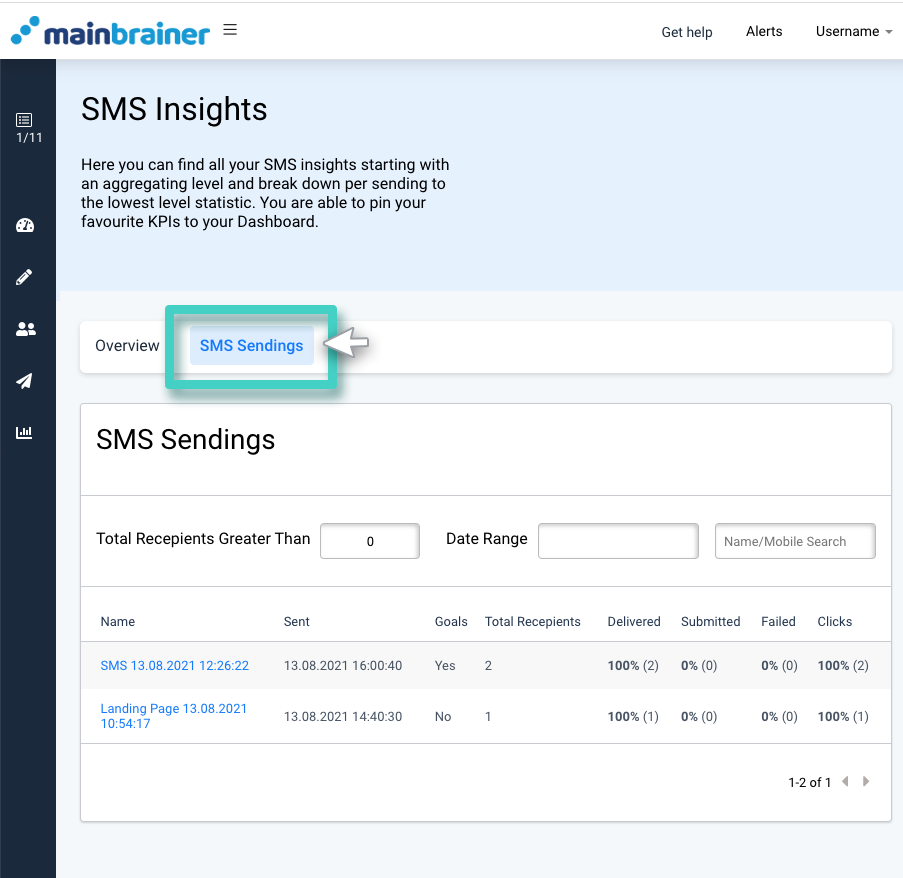
The subsequent page displays all the KPIs and their real-time values for the selected SMS sending under different tabs:

1. SMS KPIs – The data under this tab highlights the specified SMS sending’s performance statistics in the last month.
2. Recipients – The data under this tab analyses the recipient details for the selected sending, for example, the demographic makeup of the recipients, percentage of unsubscribes, etc.
3. Distribution – The data under this tab graphically displays the distribution statistics for the selected SMS sending.
4. Landing Page KPIs – The data under this tab highlights the overall performance statistics of the Landing Page sent in the SMS sending.
5. Engagement – The data under this tab highlights the widget-level conversion statistics of the Landing Page sent in the SMS sending.
6. Device – This tab graphically displays the percentage breakup of the device-types of the sending recipients.
In case you set sending goals for an SMS campaign, color-coded icons promptly display which campaigns met their intended goals, and which ones didn’t.
